Project Evolution
The beginning of the journey…
At the start of the project, we had only three things: a desire to work with maps and visualization, a barcode scanner, and a curiosity about where things come from. The original project idea was an interactive visualization of global commerce that taught a user about the origin of the materials that make up different products. As we further defined our learning goals and our sense of scope, this idea evolved into our “Where’s That Book From” program you see before you today.
Our first step for this project was to present it to our peers during an architecture review. Using their feedback we felt confident with our project idea. Within the first few weeks of work, we determined a general code structure with the class “Book” at its center. A book object contains information about a book, most of which is included in the data that belongs to an ISBN code (such as the title, author and year a book was published) but some of which we needed to find for ourselves (specifically, the locations of the author, publisher and plot). We chose to text mine from Wikipedia to obtain these locations, which half the team tackled while others worked with Python’s Plotly library to plot the locations once we found them, and developing the classBook.
In the beginning stages of work, our most arduous struggles involved text mining these locations from Wikipedia. Documentation of Wikipedia’s API is sparse and often unhelpful, which resulted in a long process of exploration, trial and error in order to build the structures we needed. We wrote over 100 lines of code that ended up being simplified down to 3.
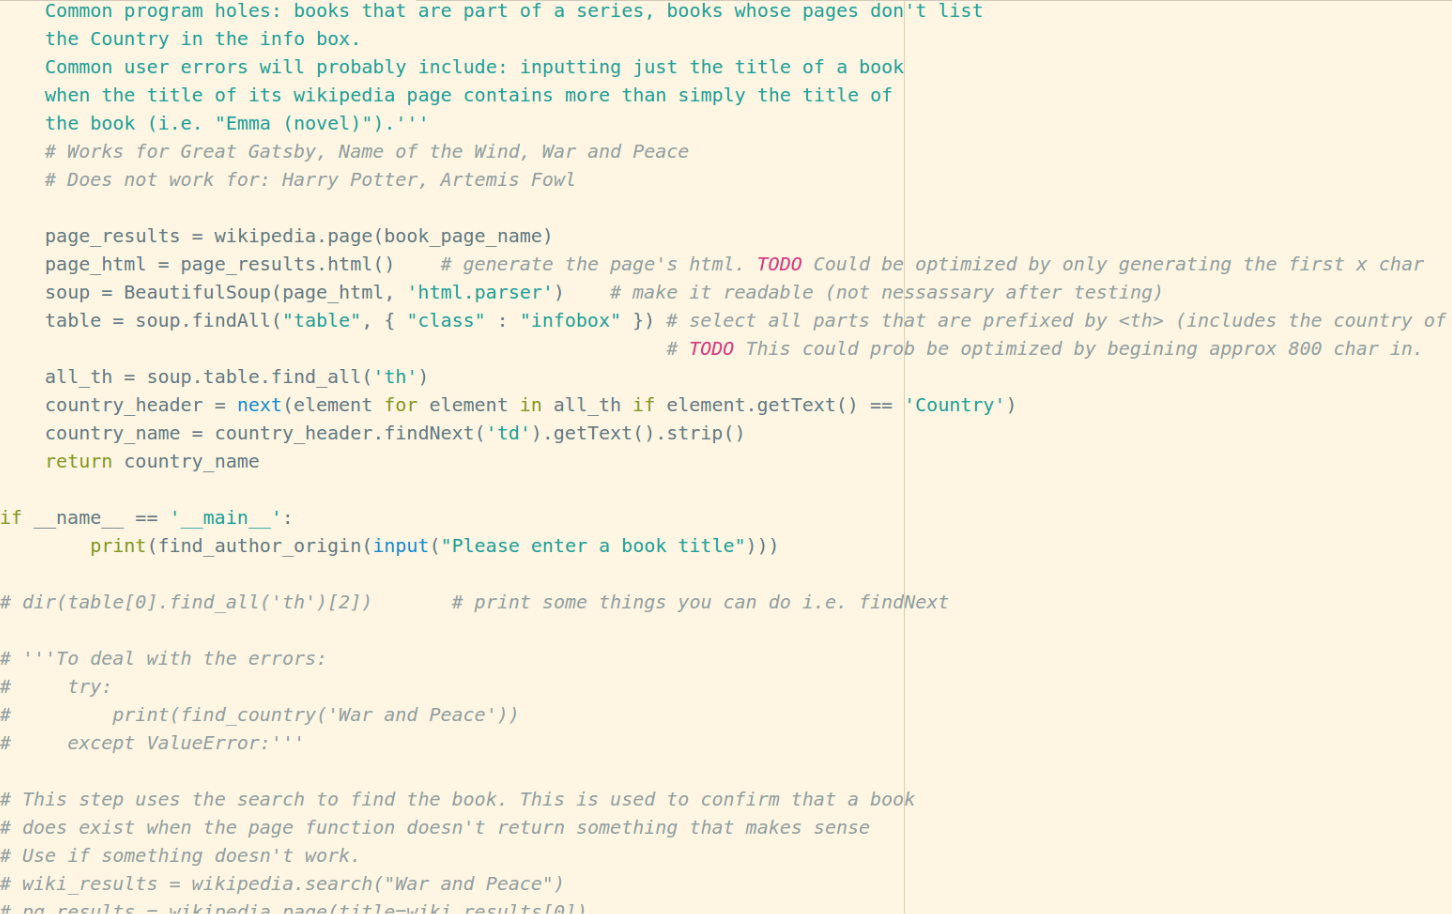
Figure 1: A snapshot/screenshot in time when we were in the midst of our “exploratory” approach to Wikipedia text mining.
Once we figured out the first stage of text mining, we progressed onward toward our next challenge: integrating the code different teammates had worked on individually. This in itself turned out to be fairly straightforward. However, through testing a variety of ISBN codes, we ran into a diversity of Wikipedia-related errors we weren’t expecting that hadn’t appeared when building the Wikipedia in isolation. Through an intensive debugging process, we determined that we had misread the Wikipedia API and one of the 3 lines of code we had at the base of our program was wrong. Below is a picture of the incorrect code, and correct code. The difference is, one calls the summary of a newly searched Wikipedia page, while the corrected code calls the summary of book’s Wikipedia page.

Figure 2: A screenshot of our working & not working code and results. As seen, one outputs the summary for “Kites”, while the working one outputs the summary for “The Kite Runner”.
Cleaning it up…
After writing a working script that takes an ISBN as input and returns a map with the book’s locations plotted on it, our next step was to handle all common errors. For examples, we needed the code to keep running when it couldn’t find one of the locations, so it would at least return the information it did find. For those it didn’t find, we returned the message: “Location was not found on Wikipedia.” Once the errors were handled, our next goal became reducing the number of times the text mining failed.
While a few team members worked towards this goal by revisiting our text mining code, others did an upheaval of our mapping. We switched from using Plotly to using Folium and OpenCage. We did this because Plotly would only plot countries and we couldn’t find a simple way to plot cities or street addresses. We switched to using OpenCage to find the lat/long coordinates, and then put the lat/long into Folium, which creates the map. Thanks to the switch we can now recognize and plot cities in addition to countries. This solved the failures that occurred when a search for a location returned a city name, which Plotly couldn’t plot.
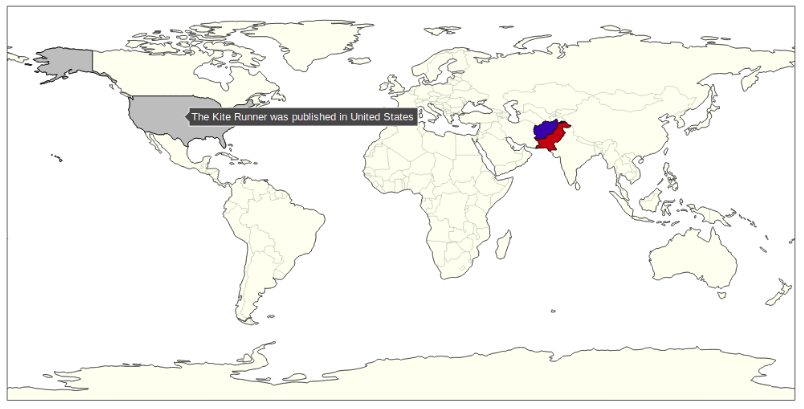
Figure 3: An example of our old Plotly map, before we stopped using Plotly.
Revisiting our original learning goals…
Sarah was interested in working with map plotting libraries and getting more practice with merge conflicts, which she did by working on the mapping integration and being named the team’s “Merge Conflict Queen” by the end of the project. Rowan wanted to work with hardware and human interfacing, which he achieved through integrating the barcode scanner and human interaction with the rest of the code. Sam’s goal was to improve her text mining skills and practice writing better structured code, which she achieved by heading up the text mining aspect of the project. Gracey was interested in learning to work with different files that were written in parallel to each other and integrating them into one functional program, which she achieved by tackling the integration aspect of the program. Lastly, all 4 members of the team wanted to practice creating clean, clear documentation, which we achieved together through robust commenting on our code and building this website.
All in all…
We feel we did a good job balancing the pursuit of our learning goals with the pursuit of a satisfactory final product. We’re proud of both the project and personal progress we made. We hope you enjoy learning about our process and hopefully find our finished product useful!